By Arif Hasan
Published in DAWN on July 31, 2022
he census of a country gives us details of its population structure, socio-economic wellbeing and the conditions of its human settlements. By themselves, the census figures do not establish trends — that can only be done by comparing previous census figures with the current ones. However, to understand these statistics in the larger context, it is necessary to compare them with statistics of a city of a similar importance and size.
In this article, we compare the results of the 1981, 1998 and 2017 censuses and try to determine how Karachi has fared over time. For certain categories, we have compared Karachi’s statistics to those of Lahore and, for literacy, educational attainment and marital rates, we have also compared them to those of Delhi. Using statistics from the population censuses of Karachi, Lahore and Delhi, we then reflect on the main findings of our work.
DEMOGRAPHY
Between the 1981 and 1998 census, the population of Karachi increased from 5,437,984 to 9,856,318. This means an average increase of 3.56 percent (or 259,902 persons) per year. Between 1998 and 2017, on the other hand, Karachi’s population increased by 6,168,576 to 16,024,894 or at an average of 2.59 percent (324,661.89 persons) per year. The city’s density also increased from 2,794.53 persons per square kilometre to 4,543.49 persons per square kilometre in the intercensal period, creating severe environmental problems.
It goes without saying that these figures make Karachi the largest and, in population terms, the fastest-growing city in the country. However, Karachi is also unique in other ways. One, it is the only place in Pakistan where local and provincial leaders and citizens have questioned the census results and insisted that Karachi’s population is above 25 million. Credence is lent to this by the figure quoted in NewGeography.com, an authoritative organisation that monitors the population growth of cities around the world, which estimated Karachi’s population at 22.8 million as of April 2016.
City planning across the world relies heavily on census data and estimates of the population the city is being planned for. What does the census tell us about Karachi, the largest and fastest-growing city in the country? And how has the population, and the city, evolved over the years?
Among political circles, the reason for not giving Karachi’s proper population in the census is believed to be the maintenance of a political status quo in the federation. If Karachi’s population is taken at 20 or 25 million, its seats in both the provincial and the National Assembly will increase, and so will Sindh’s share in the National Finance Commission (NFC). Sindh’s politicians, especially those from Karachi, see this as a conspiracy against the city and the province.
The other reason why Karachi is unique is that 59.94 percent of Sindh’s urban population lives in the city. In contrast, Lahore, Pakistan’s second largest city, contains only 27.42 percent of Punjab’s urban population. Peshawar and Quetta contain only 34.34 percent and 29.34 percent of Khyber Pakhtunkhwa and Balochistan’s urban populations, respectively.
Another important factor is that, between 1998 and 2017, the population increase in Karachi (6,168,576 persons) alone was more than the total combined increase in the other urban areas of the province (4,447,393 persons).
Issues related to ethnicity also make Karachi unique in contrast to other Pakistani cities. 42.30 percent of its population is Urdu-speaking and 10.67 percent is Sindhi-speaking, whereas Lahore is 80.94 percent Punjabi-speaking and Peshawar is 90.17 percent Pashto and 5.33 percent Hindko-speaking. However, Sindh as a whole is 61.60 percent Sindhi-speaking. This makes Karachi the non-Sindhi-speaking capital of a predominantly Sindhi-speaking province.
In addition, Karachi is a rich city generating considerable revenue for the federal and provincial governments. This can be judged by the fact that Karachi contributes 20 percent of Pakistan’s gross domestic product (GDP), 50 percent of the country’s revenues, 46.75 percent of direct taxes, 33.65 percent of federal excise tax, 23.38 percent of domestic sales tax, 75.14 percent of customs duty and 79 percent of sales tax on imports.
It contains the best universities and medical facilities in Sindh and is the centre of the Pakistan media industry. In addition, Karachi’s large scale industrial sector employs 71.6 percent of Sindh’s total industrial labour force; the city produces 74.8 percent of the province’s total industrial output, and it is generally believed that it contains 78 percent of its formal private sector jobs.
This enormous wealth of Karachi can only be controlled by political parties representing the Sindhi-speaking population of the province through a highly centralised form of government, while it can only be controlled by Karachi-based politicians through a highly decentralised form of government. This conflict has been at the centre of the discussion on and the failure of evolving a consensus-based local government system.

Table 1.1 gives the changes in populations of different language speakers from the 1981 to the 2017 census in Karachi. It can be seen that there has been a decline in the Urdu-speaking population (by 12.04 percent) and a substantial increase in the Pashto-speaking population (by 6.30 percent) because of continued migration from Khyber Pakhtunkhwa. However, there has also been a major influx of migrants from the rest of Sindh; this influx can be seen by the increase in the Sindhi-speaking population from 711,724 persons in 1998 to 1,709,977 persons in 2017. This is because of a shift from a subsistence to a market economy in the province’s rural areas, resulting in an increasing need for cash for survival and difficulty in generating that cash by landless labour and artisans.
Moreover, Karachi is the only major city in Pakistan to which the Sindhi-speaking population can easily migrate. Similarly, the Seraiki-speaking population, which was miniscule before the 1998 census, has increased by 589,665 between 1998 and 2017 due to the decline of feudal control and its socio-economic repercussions in Southern Punjab. These migrations are likely to continue.
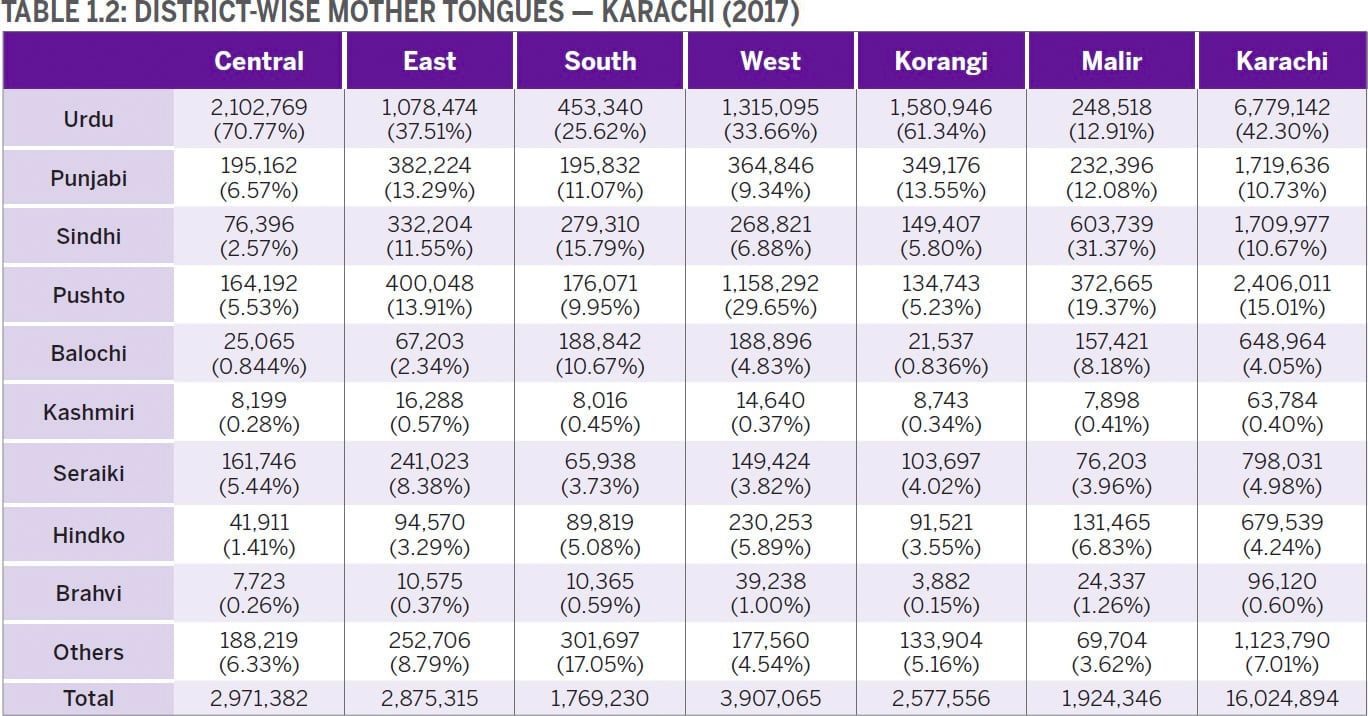
It is also important to see where the different language groups live in the city (see Table 1.2). The Urdu speakers are concentrated mainly in the Central district, where they are 70.77 percent of its population, and in Korangi, where they are 61.34 percent of its population. The Pashto-speaking population is mainly concentrated in district West, which contains a large number of Pashto-speaking colonies such as Pathan Colony, Frontier Colony, etc. The Sindhi-speaking population is mainly concentrated in the Malir district, much of which is a rural area. The Sindhi- and Pashto-speaking populations will increase their political strength considerably in the next 10 years, at the cost of the Urdu-speaking population, if the present trend of an increase in their populations continues.
LITERACY AND MARITAL STATUS
The most important age group in a census is between 15 and 24. This is because it is both the present and the future. Therefore, literacy and marriage rates, especially in this age group, and of women in particular, are important social indicators.
In the case of Karachi, the number of married women in this age group was 66.71 percent in 1961, 37.92 percent in 1981, 28.54 percent in 1998 and 30.87 percent in 2017. That of married men was 13.39 percent in 1981, 10.08 percent in 1998 and 11.24 percent in 2017.
These figures show that, today, Karachi has an overwhelming majority of unmarried adolescents in the age group of 15 to 24. Any sociologist would tell you that this is enough to change gender relations and, hence, family structures. Studies and newspaper articles tell us that this is already happening, not only in Karachi, but also in other urban areas of Pakistan — though to a lesser extent.
However, between 1998 and 2017, this trend changed for the first time since 1961 and the number of married women and men in this age group increased by 2.33 percent and 1.16 percent, respectively. In contrast, the number of married women in this age group in Lahore have continued to decrease from 27.55 percent to 27.17 percent during the intercensal years.
Here, a comparison with Delhi, a city of a size similar to Karachi in India, would not be out of place. The number of married women aged between 15 to 24 in 2001 was 38.23 percent, which has fallen dramatically to 31.25 percent in 2011. These percentages tell us that Delhi was, perhaps, a more conservative society than Karachi but change since 2001 has been far more rapid than Karachi, and this is perhaps also because of Delhi’s much higher literacy rates.
Interestingly, however, the divorce rates for women are lower in Delhi (0.17 percent in 2011) than in Lahore (0.70 percent in 2017) or Karachi (0.73 percent in 2017).


Literacy determines a number of things. According to the tables above, literacy in Karachi, both for males and females, and especially in the age group 15 to 24, was much higher in 1981 than in Lahore. In 1998, this trend continued. However, in the 2017 census, Karachi’s overall literacy is 78.06 percent, while Lahore’s is 84.25 percent.
Female literacy in Karachi is 77.79 percent while that in Lahore is higher than the city’s male literacy, and stands at 84.75 percent. Karachi’s performance between 1998 and 2017 has been much slower than Lahore’s, and compared to its own previous intercensal figures. The reasons for this need to be investigated.
Karachi is also unique in other ways. One, it is the only place in Pakistan where local and provincial leaders and citizens have questioned the census results and insisted that Karachi’s population is above 25 million.
Delhi’s performance has been exceptional as compared to Karachi and Lahore. As per its last census of 2011, its overall literacy rate stands at 86.21 percent, whereby that of women is 80.76 percent and of men is an impressive 90.41 percent. In 2001, it was 81.67 percent for the overall population, 74.71 percent for women and 87.33 percent for men.
The age group of 15-24 takes literacy a step further with 93.17 percent of its population, 94.19 percent of men and 91.93 percent of women being literate. In 2001, by contrast, 87.78 percent of the total population, 89.68 percent of men and 85.24 percent of women were literate within this age bracket.
Literacy also determines a number of other factors. For instance, the highest literacy in Karachi is in district Central (at 81.52 percent), which also has the highest employment rate — 34.78 percent (taken as a percentage of the district’s total population above 10 years of age).
Additionally, it has the second highest divorce rate (0.60 percent) and lowest marital rate (60.25 percent). The lowest literacy rate is in district Malir (63.69 percent). Along with this, it has the highest marital rate (63.61 percent) and lowest divorce rate (0.31 percent).
EDUCATIONAL ATTAINMENT

Educational attainment is gauged by the percentage of people with a primary education, matriculates, graduates and postgraduates. Their increase and decrease overtime shows whether the number of ‘educated’ people is increasing or not. As per Karachi’s intercensal comparisons, the higher the educational attainment, the greater women’s chances of being employed would be. The same, however, doesn’t hold true for men.
Educational attainment for all categories has increased in Karachi between 1981 and 2017. However, it has increased substantially more in the case of Lahore between 1998 and 2017, unlike in the previous census. The reason for this needs to be understood. In the case of Delhi, the figures, especially for women, are substantially high. For example, female graduates in Karachi are 12.01 percent, in Lahore 14.63 percent and in Delhi they are 21.46 percent. We need to know what the Indians do right to achieve such statistics.
In Karachi, the best social indicators related to literacy, educational attainment and marital figures are the highest in district Central, where employment figures are also the highest. The lowest figures for these are in district Malir. Comparing the three censuses district-wise shows that development takes place on a larger scale in already developed areas, although in percentage terms, statistics for the less developed areas may look impressive. The population which has completed primary education by 2017 in Karachi is considerably higher at 65.96 percent than in 1998 (57.93 percent). However, the latest figures for Lahore (68.88 percent) are higher than those for Karachi and those for Delhi are even higher (76.35 percent). The highest figures in all educational attainment categories are for district Central. Given these figures and trends, it is unlikely that Karachi’s future projections will be better than those of Lahore and Delhi. The reasons for this need to be understood by Karachi’s policymakers.
HOUSING


Karachi’s census figures for housing are really problematic. There are 2.73 million households and 2.73 million housing units. This means that there is no housing shortage in the city, unless we decide that semi-pakka and katcha houses are not considered as houses. Even they amount to only about 5 percent of total houses, calling into question the often-given figures for Karachi’s annual housing demand at 120,000 houses per year.
Between the last two censuses, Karachi’s population increased by 6,168,576 — which, at the rate of six persons per household, works out to about 54,000 houses, that is half of the officially estimated demand.
There is no differentiation in the census data between houses in katchi abadis and those in planned areas. Without katchi abadi figures, it is difficult to judge housing conditions in the city. However, it is clear that rentals have increased by 8.27 percent between 1981 and 2017. Also, today, over 15 percent of houses are owned by women — the highest being in district Central (21.12 percent). This is in contrast to 7.65 percent for the whole of Sindh (including Karachi), and 6.99 percent for Pakistan. Rented housing is 34.67 percent for Karachi as opposed to 14.05 percent for the whole of Sindh and 11.35 percent for Pakistan.
Congestion in housing is best understood by persons per housing unit, persons per room and houses with one room. Between the 1998 and 2017 censuses, there has been a minor decrease in the figures for persons per housing unit and persons per room. However, the change in houses with one room has been substantial, going down from 30.09 percent to 25.74 percent in Karachi. But these figures can be deceptive because, while certain higher-income areas have improved, studies tell us that conditions in the old katchi abadis have become unbearably congested.
UTILITIES

Between the 1981 and 1998 censuses, the number of shared bathrooms and kitchens decreased — the former by 19.13 percent and the latter by 12.92 percent. This means that a larger number of Karachi families had these facilities within their homes. However, access to potable water has been continuously decreasing for Karachi between 1981 and 2017, falling from 94.91 percent to 83.37 percent, whereas the opposite trend has emerged in Lahore, with the figures increasing from 54.97 percent to 88.99 percent during the same period of time.
On the whole, the figures related to utility connections for Karachi are similar to those of Lahore. In terms of percentage, they are in the 90s — barring potable water, which is in the 80s. However, we know that water supply is not available to the citizens, connections or no connections, and that electricity (especially in the summers) is subject to loadshedding from anything between three to 14 hours per day in various parts of the city. As such, the figures on utilities do not give us the right picture.
EMPLOYMENT
It is interesting to compare the employment rates in Lahore and Karachi. The Employment rate in 1981 was higher in Lahore (at 35.23 percent), but for women it was higher in Karachi (at 3.71 percent). In 1998, things changed: the employment rate was higher in Karachi for all categories.
In 2017, the Lahore employment rate increased to 34.45 percent while in Karachi it stood at 33.18 percent. A detailed study is required to identify trends and their causes and repercussions. It is also important to note that in both cities, employment figures fell between 1981 and 1998, and then rose again in 2017, but not to the level of 1981.
These differences between the two cities tell us that Karachi has not been able to maintain its rate of economic growth and social upward mobility. For women, though, the 1981 stats fell in 1998, and then rose again in 2017 to levels higher than those of 1981.
It’s also important to note that these stats include figures on the formally employed population, as well as unpaid family work — of which the latter is largely performed by women in most households. The census data, however, doesn’t reflect this as only about seven percent of women are shown as employed in both Karachi and Lahore.
TAKEAWAYS:

In this file photo, an enumerator marks a house after collecting information from a resident during a census in Karachi | AFP/File
- Between 1981 and 1998, Karachi’s social indicators improved considerably. However, between 1998 and 2017, the rate of improvement slowed down. Meanwhile, between 1981 and 1998, Lahore’s social indicator figures were less than those of Karachi, but between 1998 and 2017, Lahore’s social indicators — especially literacy and educational attainment — not only improved significantly but are now well ahead of Karachi.
The same holds true for housing and amenities such as water supply. The social indicators of both Lahore and Karachi, and their rate of improvement, are not even a patch on those of Delhi (especially those on literacy and educational attainment), except for Delhi’s low rate of divorce and more female marriages in percentage terms. Perhaps, it is time that we try and understand the reasons for these trends. Where have we gone wrong and why?
- The positive change that had come by 1998 in women’s social indicators (such as decreasing rates of marriage) in Karachi couldn’t continue. While education-related stats improved, they did so at a slower pace between 1998 and 2017 than they did between 1981 and 1998.
- The categories in the census are not defined, due to which an analysis is difficult to make. For instance, there were issues with categories such as “housing units” and “households”. A “household” is defined as “a group of persons living together who have collective arrangements for cooking/eating.” While the 2017 census data reports 97.7 percent housing units with a kitchen, the number of housing units is equal to that of households (implying that there is no shortage of “households” in Karachi).
- As mentioned above, the census is without specified definitions. When looking at the census, we are not told what comprises housekeeping as compared to “unpaid family labour”. In the previous censuses, a number of categories were listed under “employment” and an “economically active” population was defined.
Furthermore, female employment figures are incorrect because large numbers of females work on a contract basis (with raw materials provided by middle men or otherwise); they consider themselves to be housewives and do not classify themselves as employed.
- The number of people living in informal settlements needs to be stated categorically, especially since, according to census figures, utilities such as gas, electricity and water have been provided to nearly 95 percent of housing units in Karachi.
- Generally, the statistics given for utility provision seem improbable, as their percentages are in the 90s. Yet, according to the print and electronic media, there are long periods of electricity outages, absence of gas in the pipelines, absence of water in certain localities for weeks on end and overflowing sewage. Is there any way in which the census can take count of this? It may help us understand the gravity and scale of the situation.
- A major change has taken place in the registration of demographic data in the 2017 census. For the first time in Pakistan’s census history, the transgender population has been recognised. However, because of an absence of knowledge and social acceptance, the community’s representatives feel that it is grossly understated.